This page gives details on the widgets that are in the “Competition” subsection. They can be accessed by customizing the XCTrack Pro pages pre-installed on AIR³. Remember that your customisations will be lost if you reset XCTrack Pro interface with AIR³ Manager, if you change the profile (Kiss, Easy, Expert, Paramotor) or if you load a different configuration file ‘xcfg’.
Read more details about competition in Menu/Navigation/Competition of the main XCTrack Manual.
A video tuto for competition has also been produced. Watch it in the video’s page.
Click on the + sign to read the details.
The Task map widget is divided into 2 main sections: Map configuration, Postpone airspace showing.
Click on the "+" sign to unfold the section.
Click back on the "-" sign to fold it back.

You can choose a style for the map widget that differs from the main theme.
This can be quite convenient for the map widget, so that you can get the benefit from the Black theme to reduce energy consumption for the main widgets and still use a White style for the map widget so that you can easily read information on the map. Not all pilots are used to read maps with a white on black map.
In the Map configuration section, you can
- decide the road map and terrain style to use
- decide which map overlay theme you want to use
- decide the way you want the maps to be displayed according to what should be at top (read more in the next section below)
- display a small compass on the map to display north direction
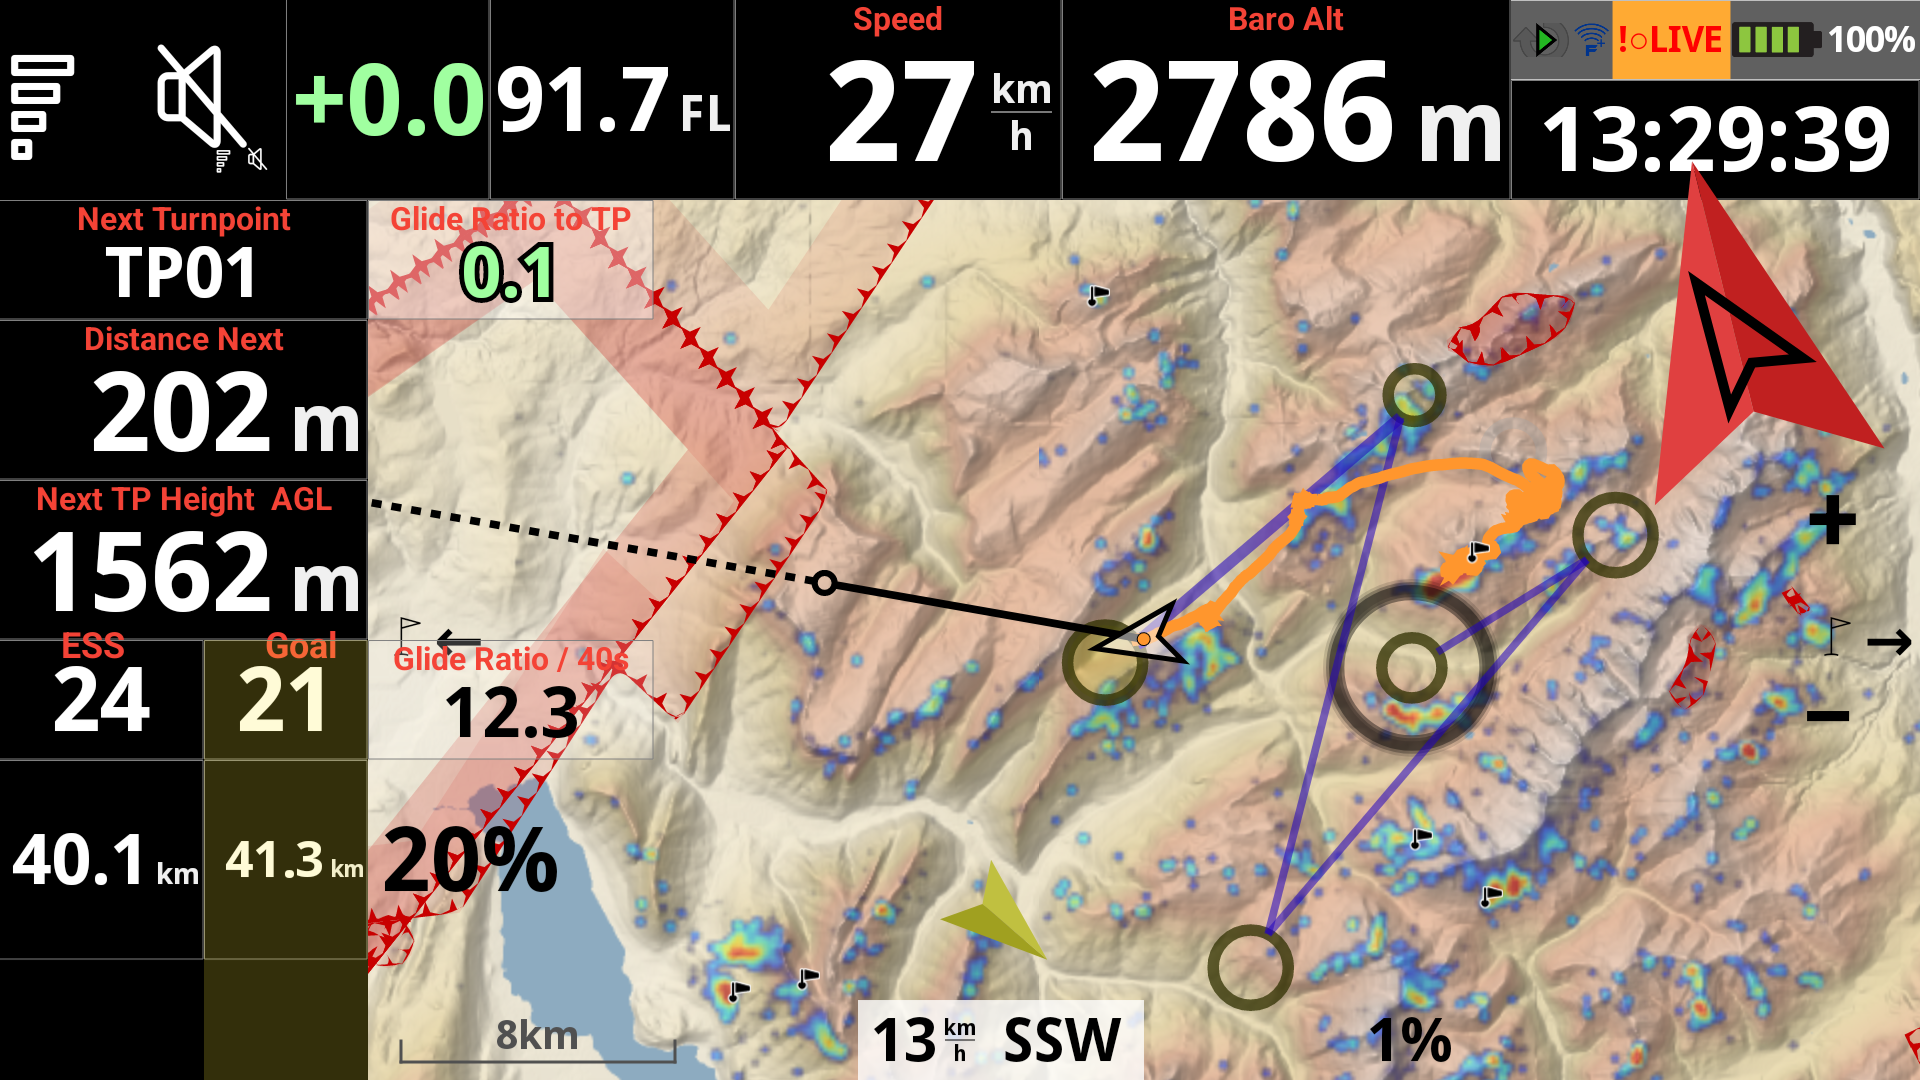
- activate the automatic map scaling to fit the next turnpoint (recommended) or define a fixed map scale (see additional info regarding automatic map scaling below)
- keep pilot in the center of the screen or at a given distance from the edge in case you have not chosen the automatic map scaling (see additional info regarding distance from the edge below)
- display the map scale in the bottom left of the map
- Show relative position in pan mode

Road map and Terrain Style
A “style” is the combination of a Roadmap Theme Type and a Terrain Type.

Terrain type
Terrain type is the way Terrain is rendered. 3 types: LIGHT, DARK or XCONTEST.
Here below, the map widget is set with no Roadmap, only Terrain with the three Terrain types.
LIGHT
DARK
XCONTEST
Roadmap Theme Type
Roadmap Theme Type is the way Roadmap is rendered. Let’s consider two categories: classic and transparent.
Classic Roadmap Theme Types are legacy types such as Lightpilot, Hyperpilot, VTM, Newtron, etc. Some of them can be displayed with mainly white or mainly black rendering. Rendering a Classic Roadmap Theme Type with the Terrain Type is more like hillshading, while rendering a Transparent Roadmap Theme Type with the Terrain Type is much more powerful to clearly see the relief.


Transparent Roadmap Theme Type is based on Clearpilot. You can choose between different variants, ligther or darker, with forests or not, with bigger fonts… Together with the Terrain Type, you can choose you favorite rendering.


Here is the rendering of the map widget with Clearpilot (forests) and XCONTEST style.
Custom Map Type
You can choose one of the available Road map and Terrain Styles, or use a Custom Roadmap Theme Type based on a custom XML file that you can select in Preferences/Maps/Roadmap.
AIR³ proposes a special Custom version based on Clearpilot called Clearpilot-AIR3-BIG-CITIES. If you want to take advantage of it with your AIR³, get the latest version of AIR³ Manager (> 3.0) and the latest version of XCTrack (>0.9.12). Reset the XCTrack interface as explained here and you will benefit from this special version.
Note that the rendering may vary significantly depending on the zoom level.


Map overlay theme
The Map Overlay Theme is what used to be called “widget theme”. It refers to how XCTrack will draw objects like FAI sectors, cylinders etc.
Automatic will use the appropriate mode depending on the main display theme and the map style. For example: with Black High Contrast as system theme and a dark map, the Map overlay theme will be black high contrast. If the map is not dark, it will use white high contrast for overlay.

Black
White
White high contrast
eInk
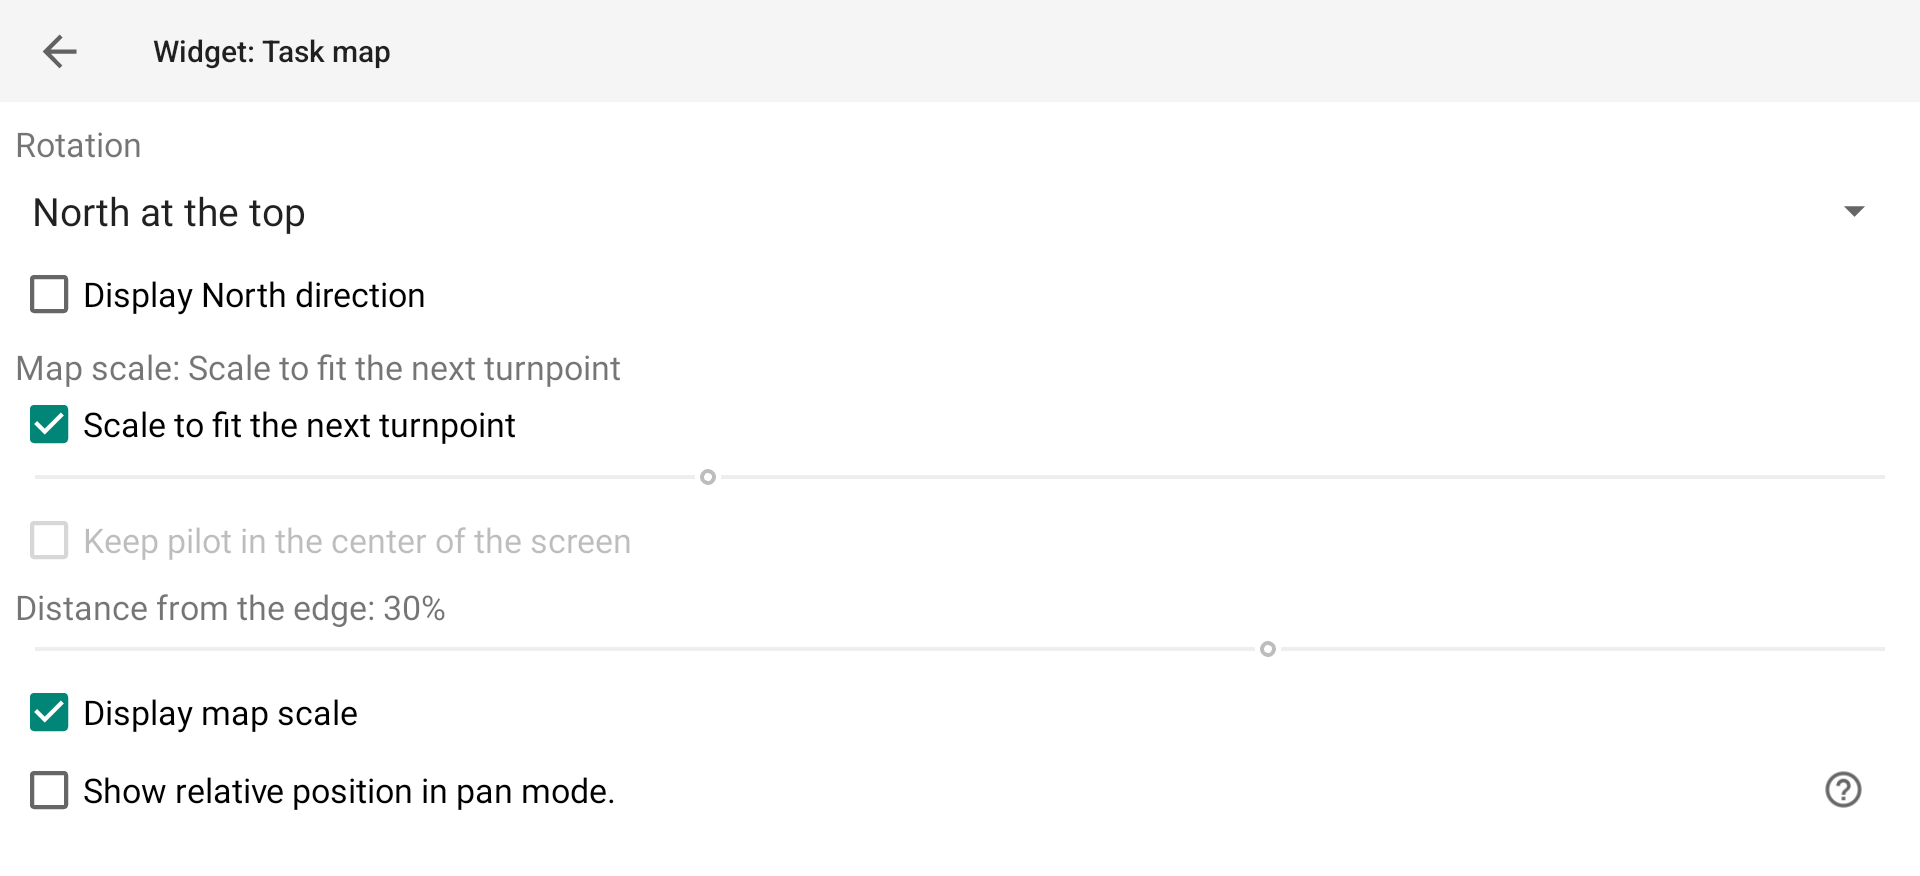
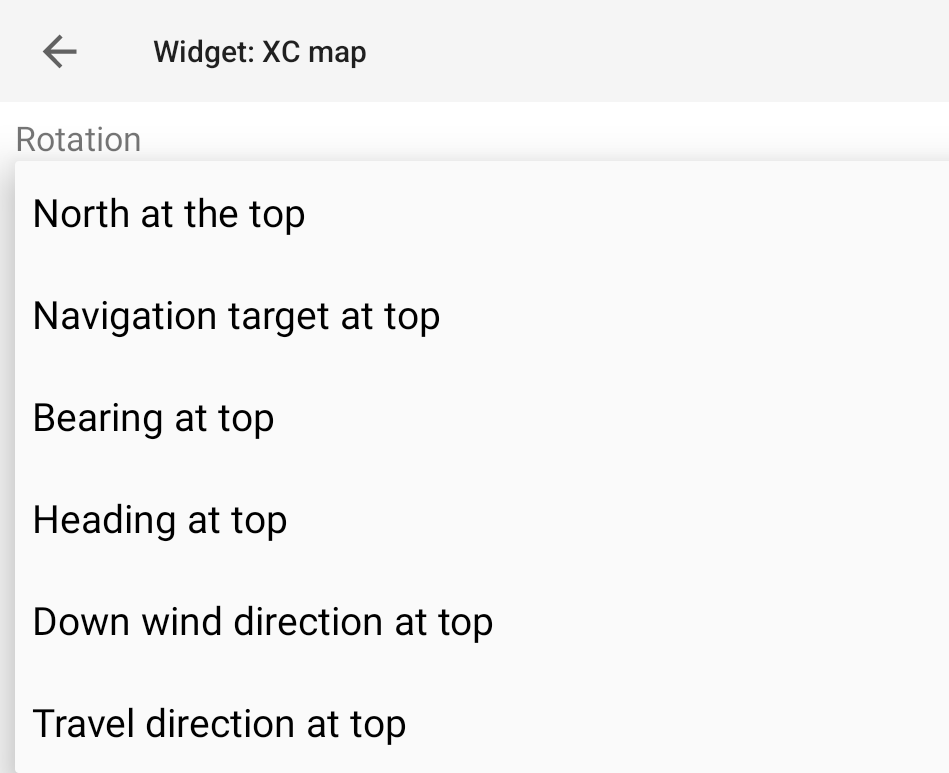
Rotation
Using AIR³ for free flight, rotating in circles in the thermal, it is recommended to keep north at top. If you want the map to rotate while you are moving (such as with paramotor), you have different choices.
- North at the top
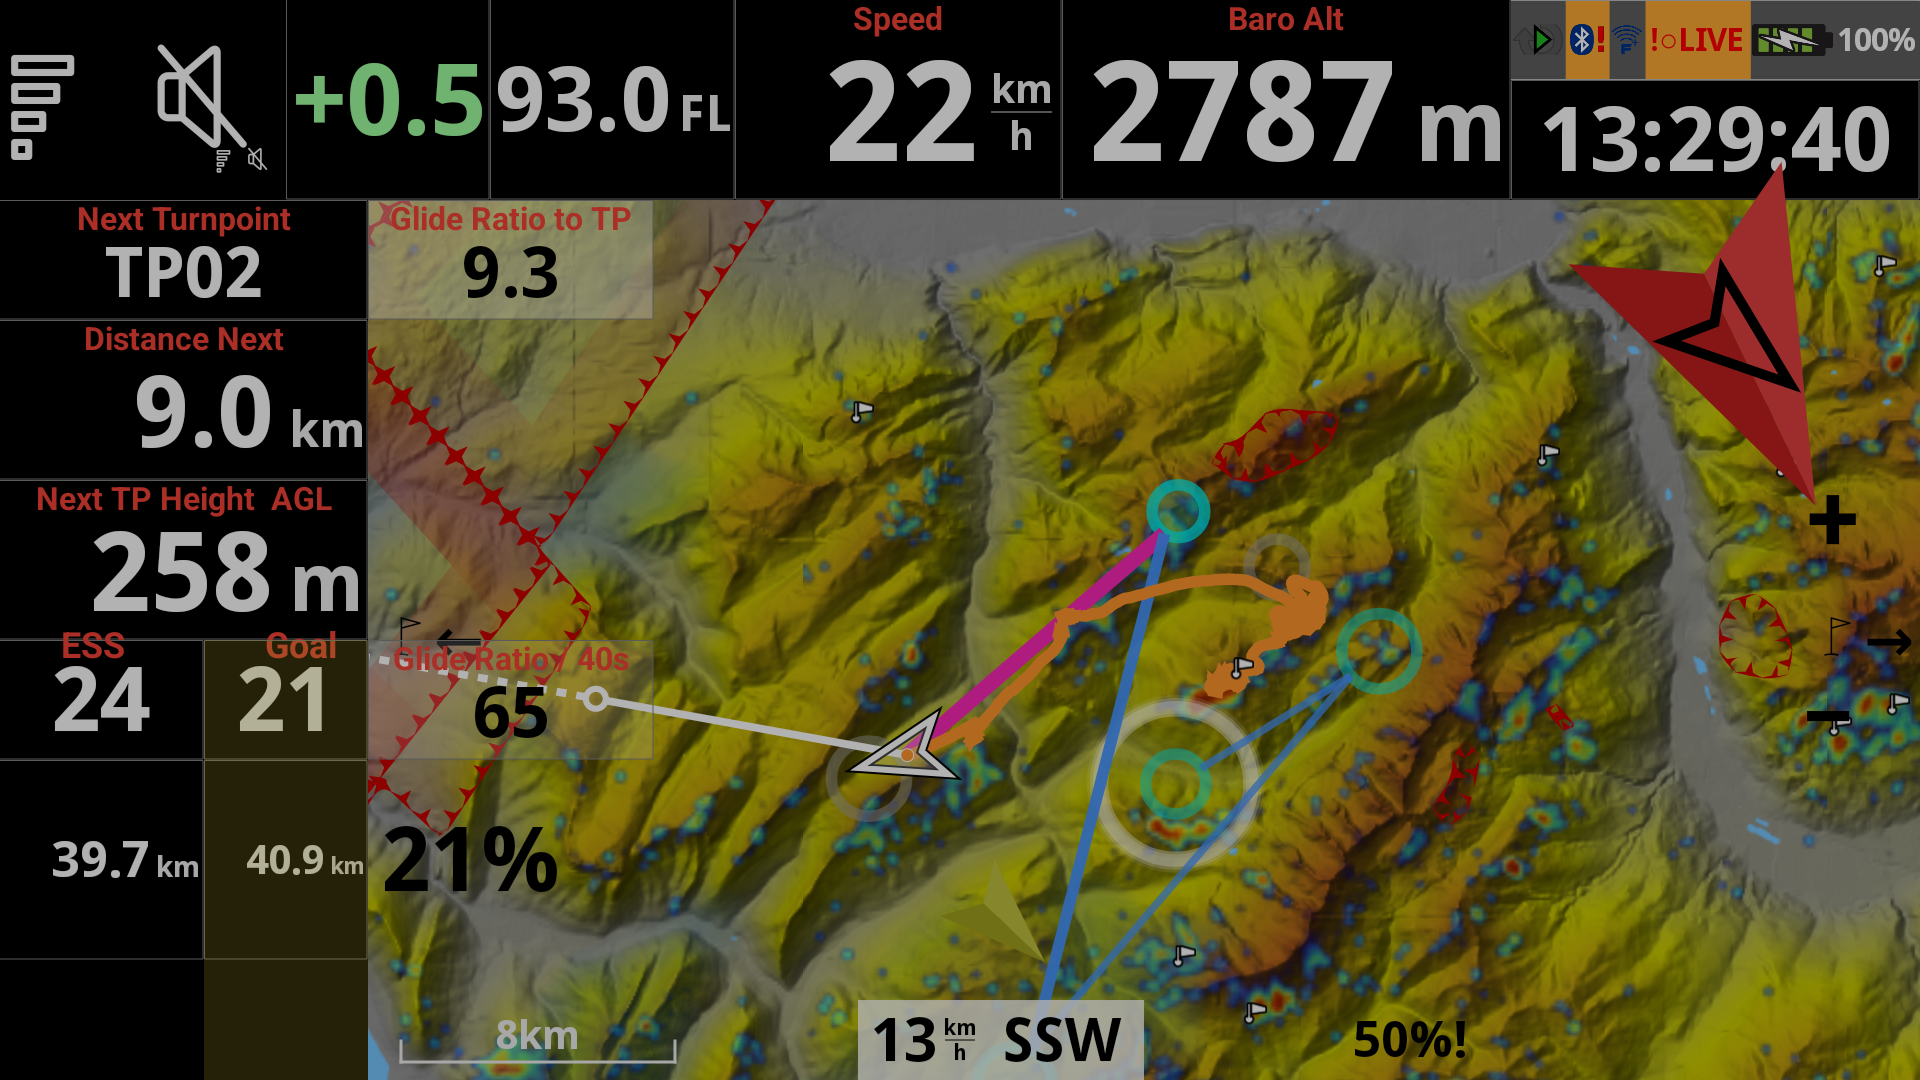
- Navigation target at top is used to always have your target at top.
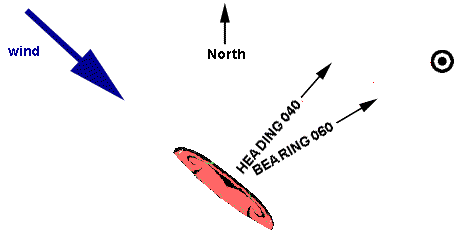
- Bearing at top is used to always have where you are going to at top (can be influenced by the wind).
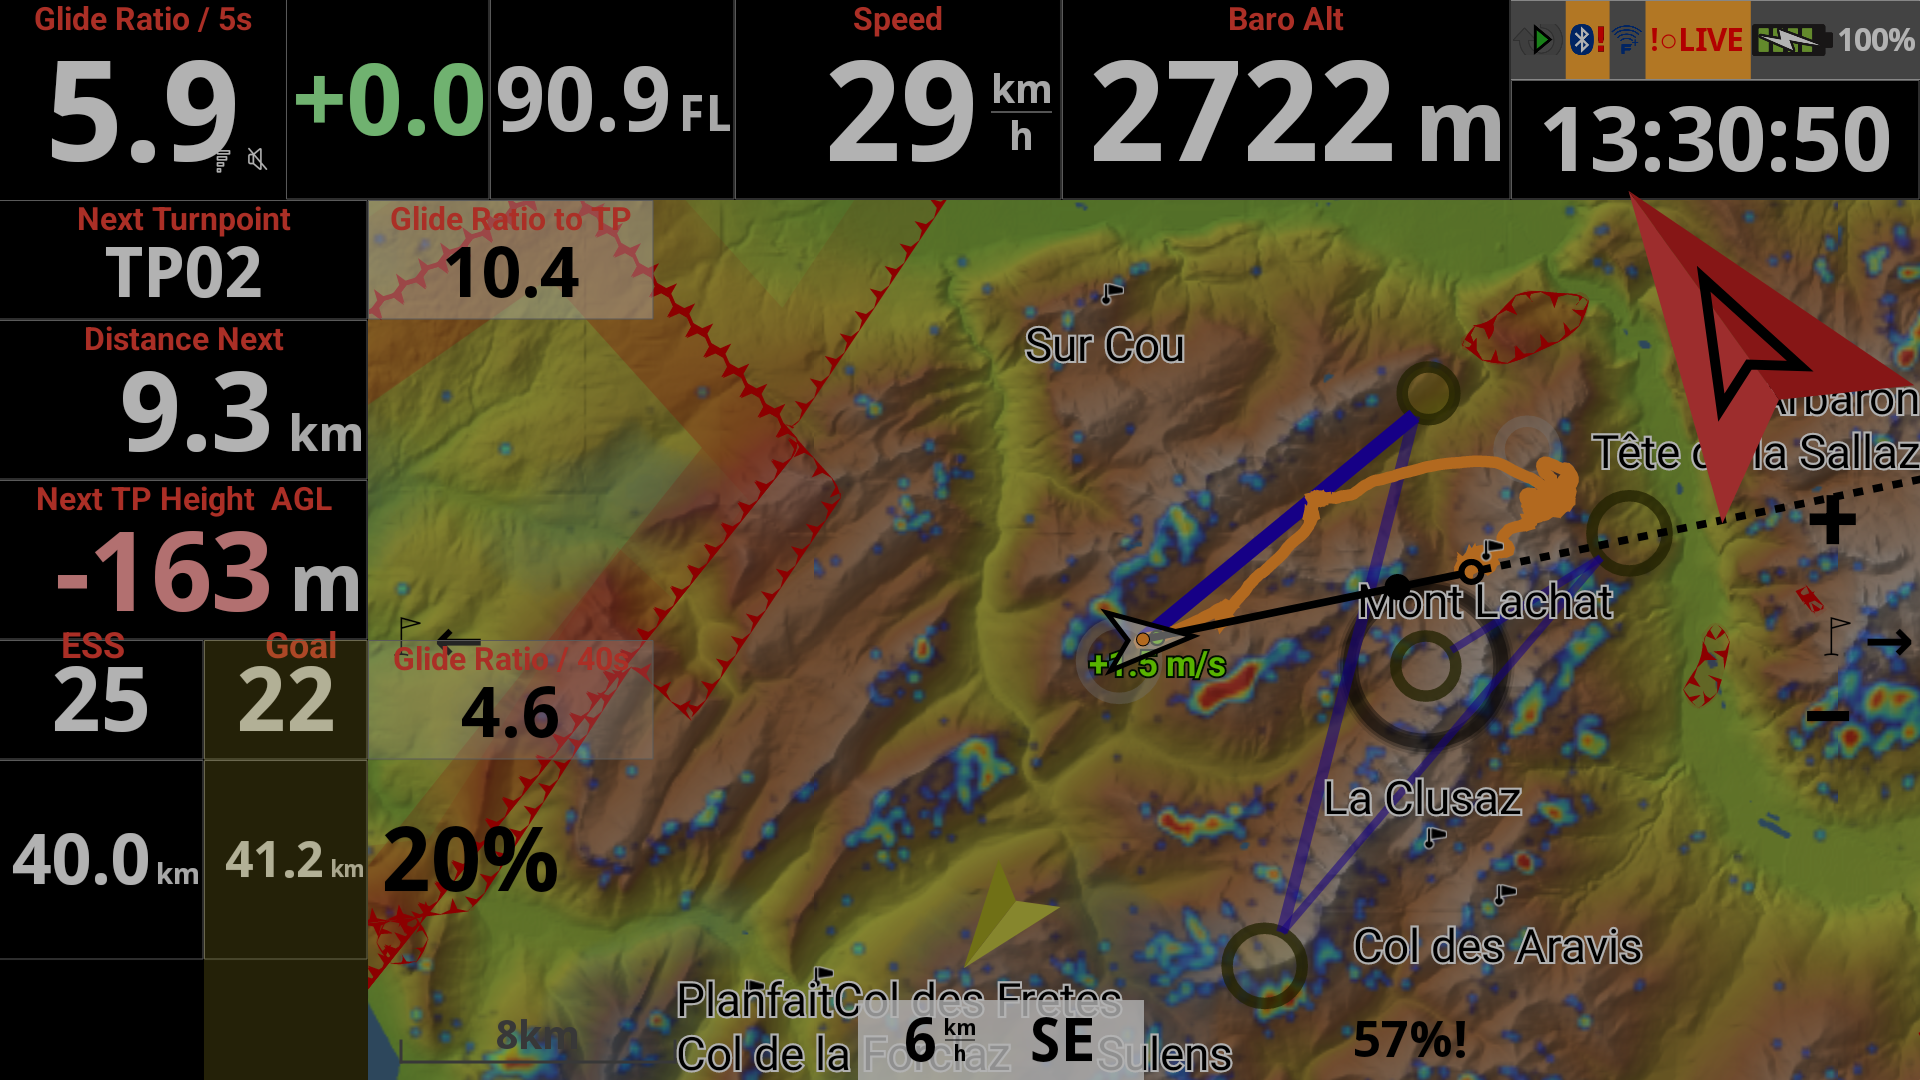
- Heading at top is used to always have what you have in front of you at top.
- Wind direction at top (see below more details)
- Travel direction at top (see below more details)
By default, XCTrack uses the bearing/track direction thanks to the GPS, the wind speed and direction to compute the heading direction.
By enabling “Use internal compass” in Menu/Preferences/Connection & sensors, XCTrack uses the information coming from the internal compass to display the heading.
Read more details on using the internal compass in the Preferences page of XCTrack Pro manual.
-> Once the wind has been computed after a full circle, you may also want to have your map rotated to always have the down wind direction at top.
Downwind direction at top requires to have computed the wind direction. So, in any case, the map will get North at top at the beginning of the flight. Read more details about Wind direction computation in the Wind direction widget description in the Air section page of the XCTrack Pro Widgets Manual.
-> Travel direction at top is used to have your travel direction at top. The goal of this setting is to have less map rotation than Bearing at top, still with the main direction where you are going to at top.
Travel direction at top requires to have computed the Travel direction. So, in any case, the map will get North at top at the beginning of the flight.
Travel direction gets changed when BOTH of these conditions are satisfied
– the user has traveled for more than 3 km in 20 minutes
– the user has been traveling directly for about 2 minutes
… Then, the direction is changed, with preference for the angle traveled if it doesn’t differ too much from the 2 minutes bearing.
Display North Direction
Adds a small compass on the map to show you the north direction.
Autoscale to fit the whole tracklog
This setting allows to scale the map to view the whole track. It has been designed for flying closed triangles (FAI or flat). Therefore, this setting may not be very useful for flying straight distance. As soon as you zoom in or zoom out, the automatic map scaling will be disabled.
Keep pilot in the center of the screen
By default, the pilot will be centered in the center of the screen. It corresponds therefore to 50% of the distance of the widget.
If you disable this setting, you can choose a different distance from the edge by moving the slider to increase up to 40% (close to the center) or decrease down to 10% (close to the edge).
The off-center function works this way:
– there is speed history for 20 minutes
– when your 20 minutes speed is similar to the XC speed (this means you’re on your way), your position is moved from the center of the map
Note that if you replay a tracklog, this algorithm should only work if you replay it slowly (max 3X).
Show relative position in pan mode
Allows you to know your position relative to the center of the map while panning the map ( see here how to enter pan mode).
Useful when you need to know your relative position to a place (airport i.e.).
You can change the unit in Menu/Preferences/Display/Units.

In the Map configuration section, you can also:
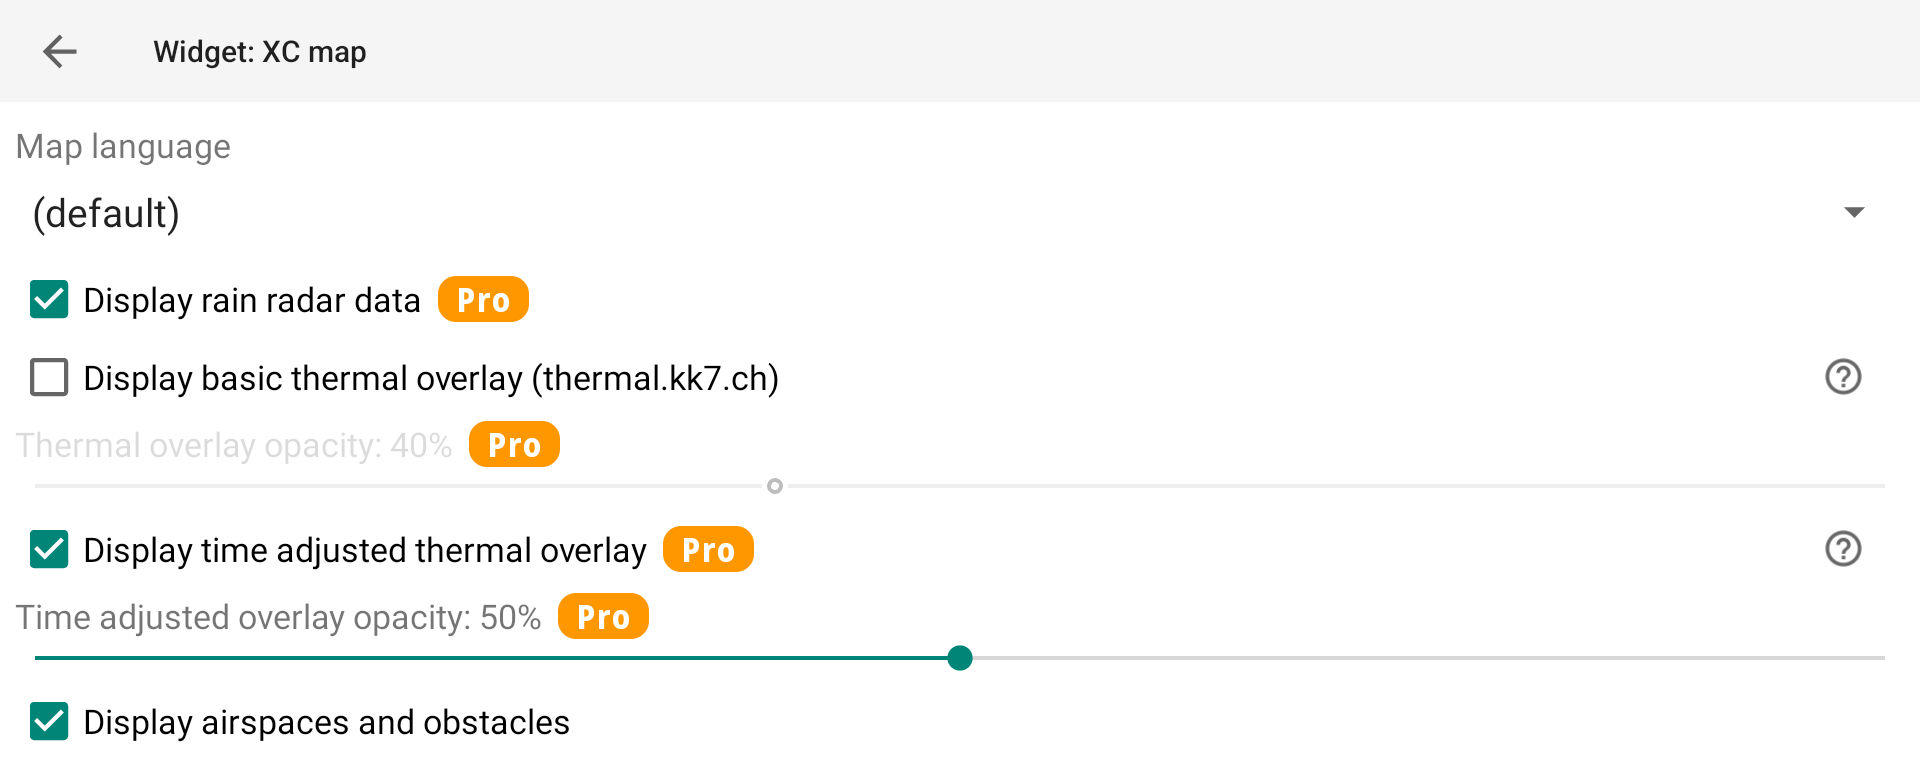
- define the map language
- display or not the rain radar
- display or not the thermal overlay
- display or not airspaces and obstacles
Map language
You can define the language of your map that can differ from XCTrack default language. Note that this will be valid only if your Roadmap file supports the language you select. Check on Openandromap website whic languages are supported in your region.
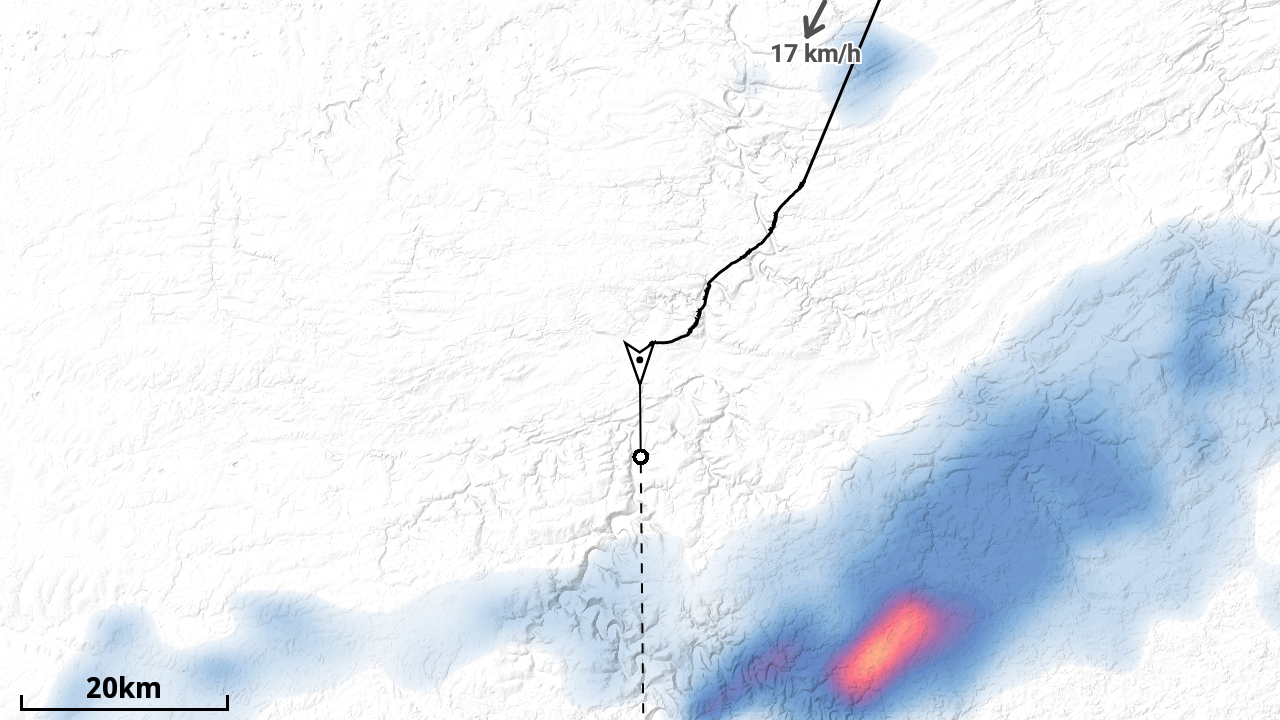
Rain radar
Rain radar can be displayed by enabling the “Display Rain radar data” option. To be able to enable this option, you need the Pro version.
With the color screen of AIR³ you can take advantage of all the information that are provided by the rain radar map. You can easily analyse the intensity of rain on your way. This would be more difficult to read with black and white screens. However, we do not recommend to display Road maps together with Rain radar for improved readability.
It is updated every 10 minutes. The data load is negligible. If it rains, there would be a few kilobytes, a maximum of tens of kilobytes transferred. It uses the same service that anyone can see on the Livetraking web page.
The rain radar tiles are displayed exactly over the visible area on the map.
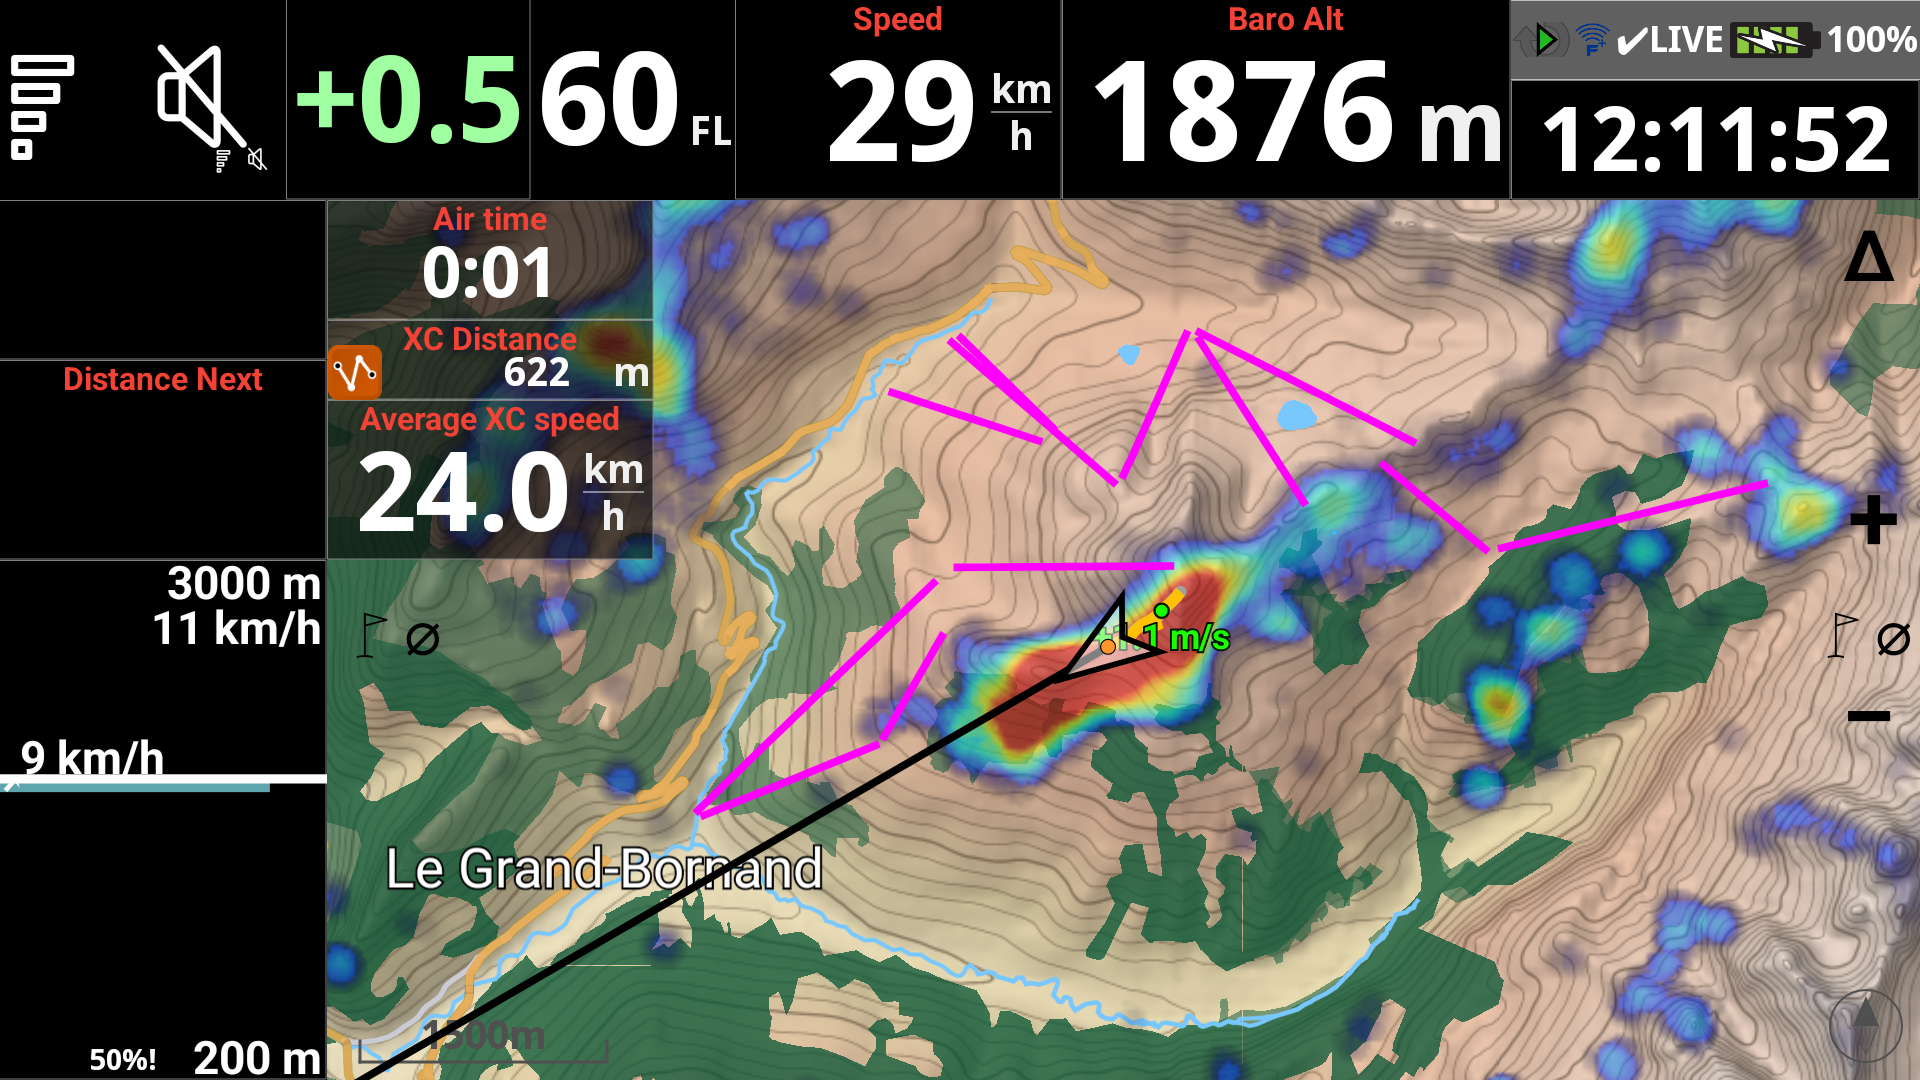
Thermal overlay
Thermal overlay (or also called thermal map) shows the probability to find a thermal uplift at a certain geographical location using a paraglider. The thermal maps are solely based on real flights and void of any model data. Data come from thermal.kk7.ch.
To be clear, the thermal map is a map of thermals calculated by analysing a large number of flights. It doesn’t correspond to the thermals associated with the current weather situation you have on any given day.
Once you have enabled the Thermal Map option, you will need an Internet connection to allow XCTrack to download the information for the area being displayed. Once downloaded, you won’t need an internet connection. However, if you move to a different location without an Internet connection, you won’t be able to get the information for the new area. In other words, you don’t need an in-flight connection to get the thermal map overlay if you’ve prepared your flight while connected, but it’s much easier if you have an in-flight connection.
All thermal maps correspond to a location on the ground where the thermal would originate from. Depending on your altitude, you need to determine thermal drift based on wind speed and direction.

“Display basic thermal overlay” provides information about possible thermal uplifts without any filtering (day of the year and the time of the day).
“Display time adjusted thermal overlay” provides information about possible thermal uplifts adjusted to cover current season and time of the day. For example, you can expect finding thermal uplifts in the morning from an east-facing slope and nothing on a west-facing one. However, as the data come from real flights, including flights which may have occurred on a west facing slope in the morning, thanks to a westerly wind…this will not always show up as previously mentioned.
You can easily observe these data in thermal.kk7.ch
If you select “Time filter”, you can see at a specific geographical location the change according to the day of the year and the time of the day.
By adjusting the opacity of both options, you can for example display the basic thermal overlay with a low opacity value that will always give you some info about the general situation, in the background…. and activate with a higher value of opacity the adjusted thermal overlay.
Thanks to the very bright color screen of AIR³, you can easily take advantage of this feature.
Example of a West-facing take-off site.
The AIR³ on top has been set to only Display time adjusted thermal overlay.
The AIR³ in the bottom has been set with a low opacity value to display the basic thermal overlay and a higher opacity value for the display of the time adjusted thermal overlay.

Example of a East-facing take-off site.
The AIR³ on top has been set to only Display time adjusted thermal overlay. As the flight is in the evening, there is no possible time adjusted thermal uplifts displayed.
The AIR³ in the bottom has been set with a low opacity value to display the basic thermal overlay and a higher opacity value for the display of the time adjusted thermal overlay. This allows to see the expected thermal uplifts with low opacity value.

Display Airspaces and Obstacles
Airspaces map can be shown by enabling the “Display airspaces” option.
Read more details about how to set up airspaces in Menu/Preferences/Airspace.
If you activate other maps such as Terrain and RoadMap, Airspaces will always be on top.
If you want to know more about Airspaces and how to get airspaces information with AIR³, watch the tuto video related to Airspaces in the videos page.

Obstacles will only be displayed if
- You have downloaded and activated the Obstacles database in Menu/Preferences/Airspaces/Obstacles
- You have activated the option “Show only” or “Show and alert” for the Obstacle category you intend to see on the map in Menu/Preferences/Airspaces/Settings
- You have activated the option “Display Airspaces and Obstacles”
Show alert screen when approaching an obstacle
The enabled option will change a map into a special ‘zoomed in’ mode when you get near an obstacle, so that you could see clearly where you are and where is the obstacle.
You can either decide to use the “Automatic zoom in emergency obstacle mode” or select the map scale you want to apply in case of alert when approaching obstacle.
This feature requires to have activated the obstacle alert mechanism in the Menu/Preferences/Airspaces/settings.

This special map conversion alert linked to the Obstacle alerting system will only work if
- You have downloaded and activated the Obstacles database in Menu/Preferences/Airspaces/Obstacles
- You have activated the option “Alert only” or “Show and alert” for the Obstacle category you intend to be alerted from, in Menu/Preferences/Airspaces/Settings

By deactivating this option, the Obstacle alerting mechanism will not change the map into this special ‘zoomed in’ mode when approaching an obstacle, but the alert will be displayed on top.

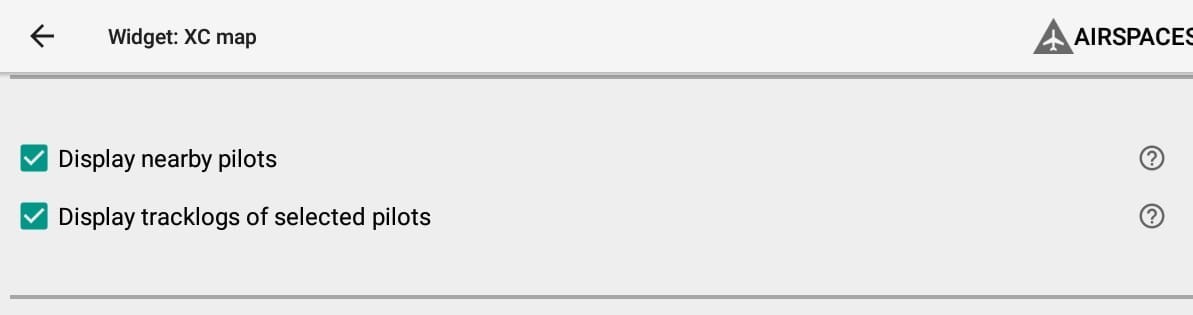
Display nearby pilots
Display nearby pilots on the map (you need to have activated the livetracking). Read more details about Livetracking in Menu/Preferences/Livetracking and Menu/Livetracking.
Display the tracklogs of selected pilots
To select pilots, go to Menu/Livetracking. In the Flights tab, you will see the list of pilots that are currently flying. You can select the pilots you want to display.
For more details regarding livetracking, watch the XCTrack Pro for AIR³ tutorial in the videos’s page
Display waypoints
Don’t forget to activate the waypoint file that contains the waypoints you want to display. Read more details about how to activate a waypoint file in the Navigation menu.
Go to Menu/Navigation and click on the Waypoints in the upper right to access the waypoint menu. In the Files tab, you can see the wpt files that are located in the Waypoints folder of XCTrack. The size of the waypoint name on the map is set in the font size portion below.
Display the large cities
Large cities of each country have been integrated into XCTrack. This option is useful if you have not activated the RoadMap display. With RoadMap display enabled, you will have the name of the large cities display twice: with the RoadMap and with the display cities option. The size of the name of the cities on the map is set in the font size portion below.
Should you want to display medium or small size cities, contact us to get a Waypoint file.
Display takeoffs

Show navigation
With AIR³, the main arrow that indicates the direction of the target is included on every page. To avoid creating confusion with other information on the map, navigation is set to “Do not use” on the XC Map widget.
However, here are some details if you want to display navigation instructions directly on the XC Map widget. Two different options are offered:
- Type of navigation mode (Point, Optimized point, Cylinder (nearest point) or Do not use.
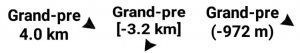
- Activate “distinguishing brackets” in order to quickly identify your previous settings:
Point mode [Optimized point] (Cylinder)


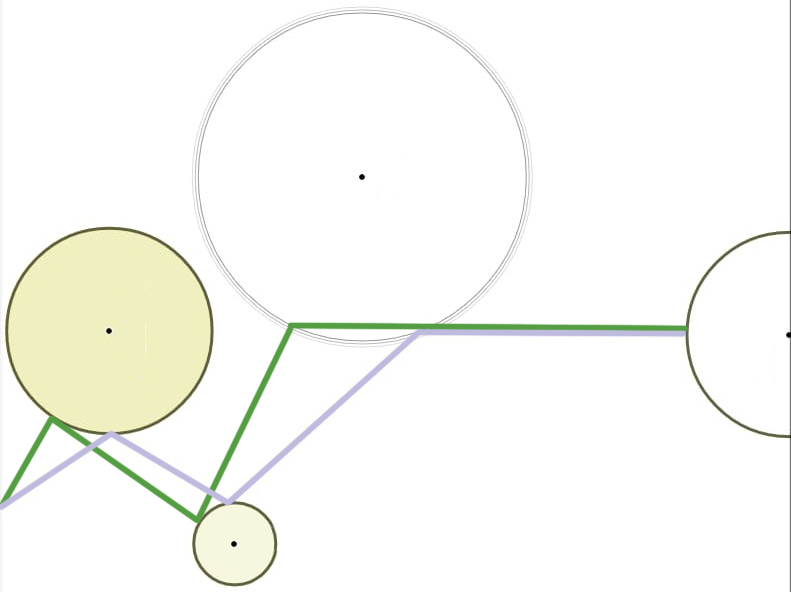
Different settings are available for navigation depending on your preferences:
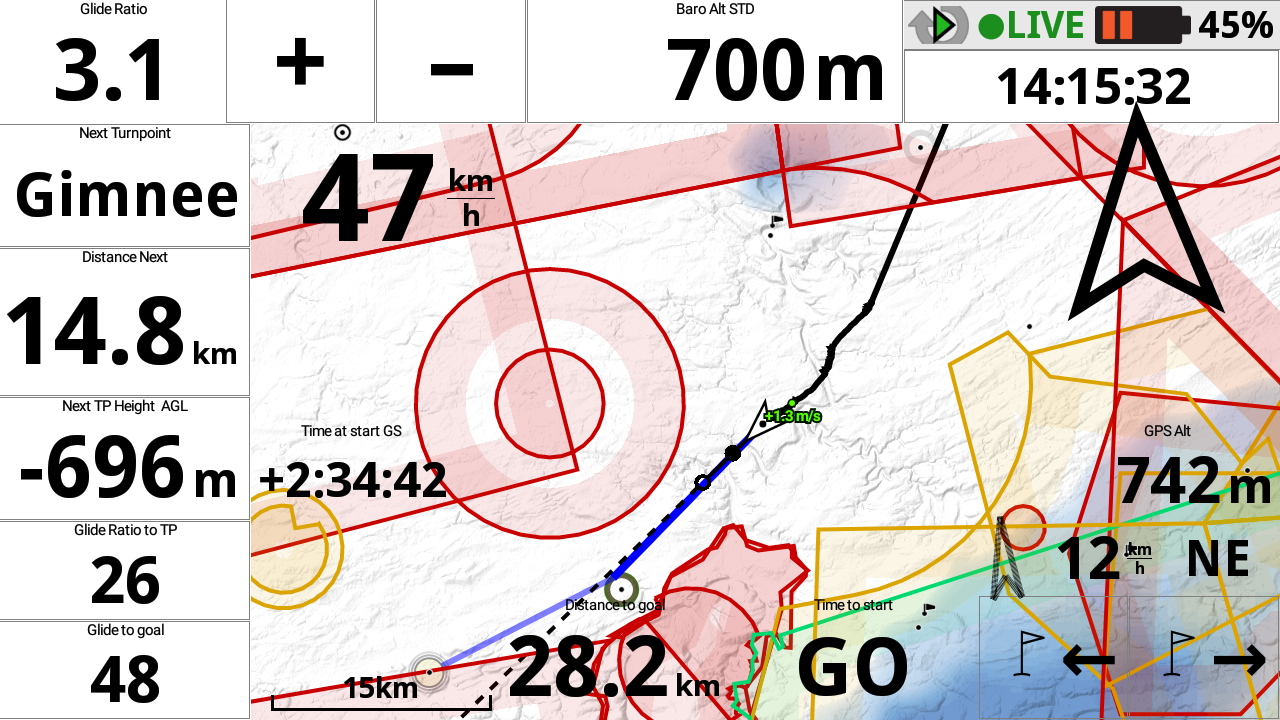
- “Point” indicates the direction to the exact target. Green line. The difference with “Cylinder” is that the distance, glide, time,etc. are calculated up to the point/target. However, once the circle around the target is reached, the navigation will switch to indicate the next point.
- “Optimized point” indicates the direction to the optimized point depending on your route. This is the most used setting. Blue Line.
- “Cylinder (nearest point) indicates the direction of the nearest point of each circle once the previous is reached. Green line. The difference with the “Point” is that the distance, glide, time, etc. are calculated up to the circle to reach.
- “Do not use” is the setting to not show navigation.
Show lastest thermals
The next slider lets you decide the number of last thermals to show on the map together with its climb rate.
The number corresponds to the average climb and the color depends on that value.
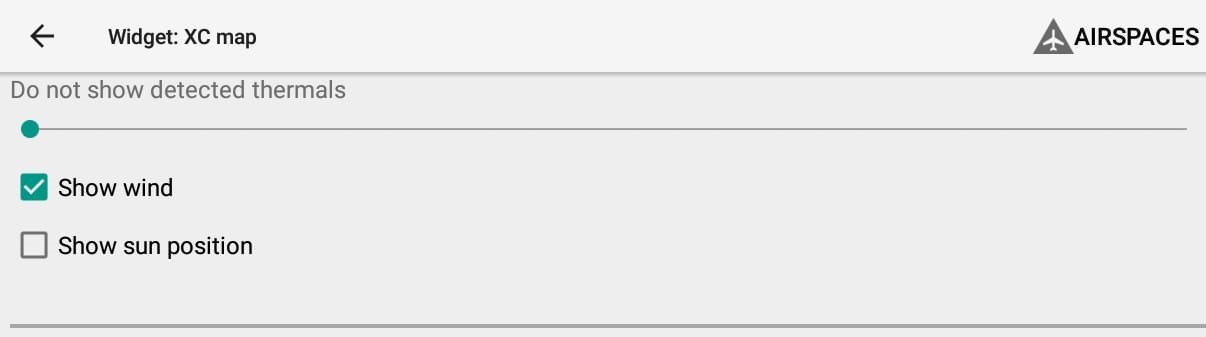
Show wind
Show wind displays a small arrow on the map to indicate the direction, with the speed of the wind. Wind is computed the completion of a full circle.
Show sun position
The sun and the wind display are located on the border of the map widget. If you display also the RoadMap, you may create some mess, not being able to identify information correctly.


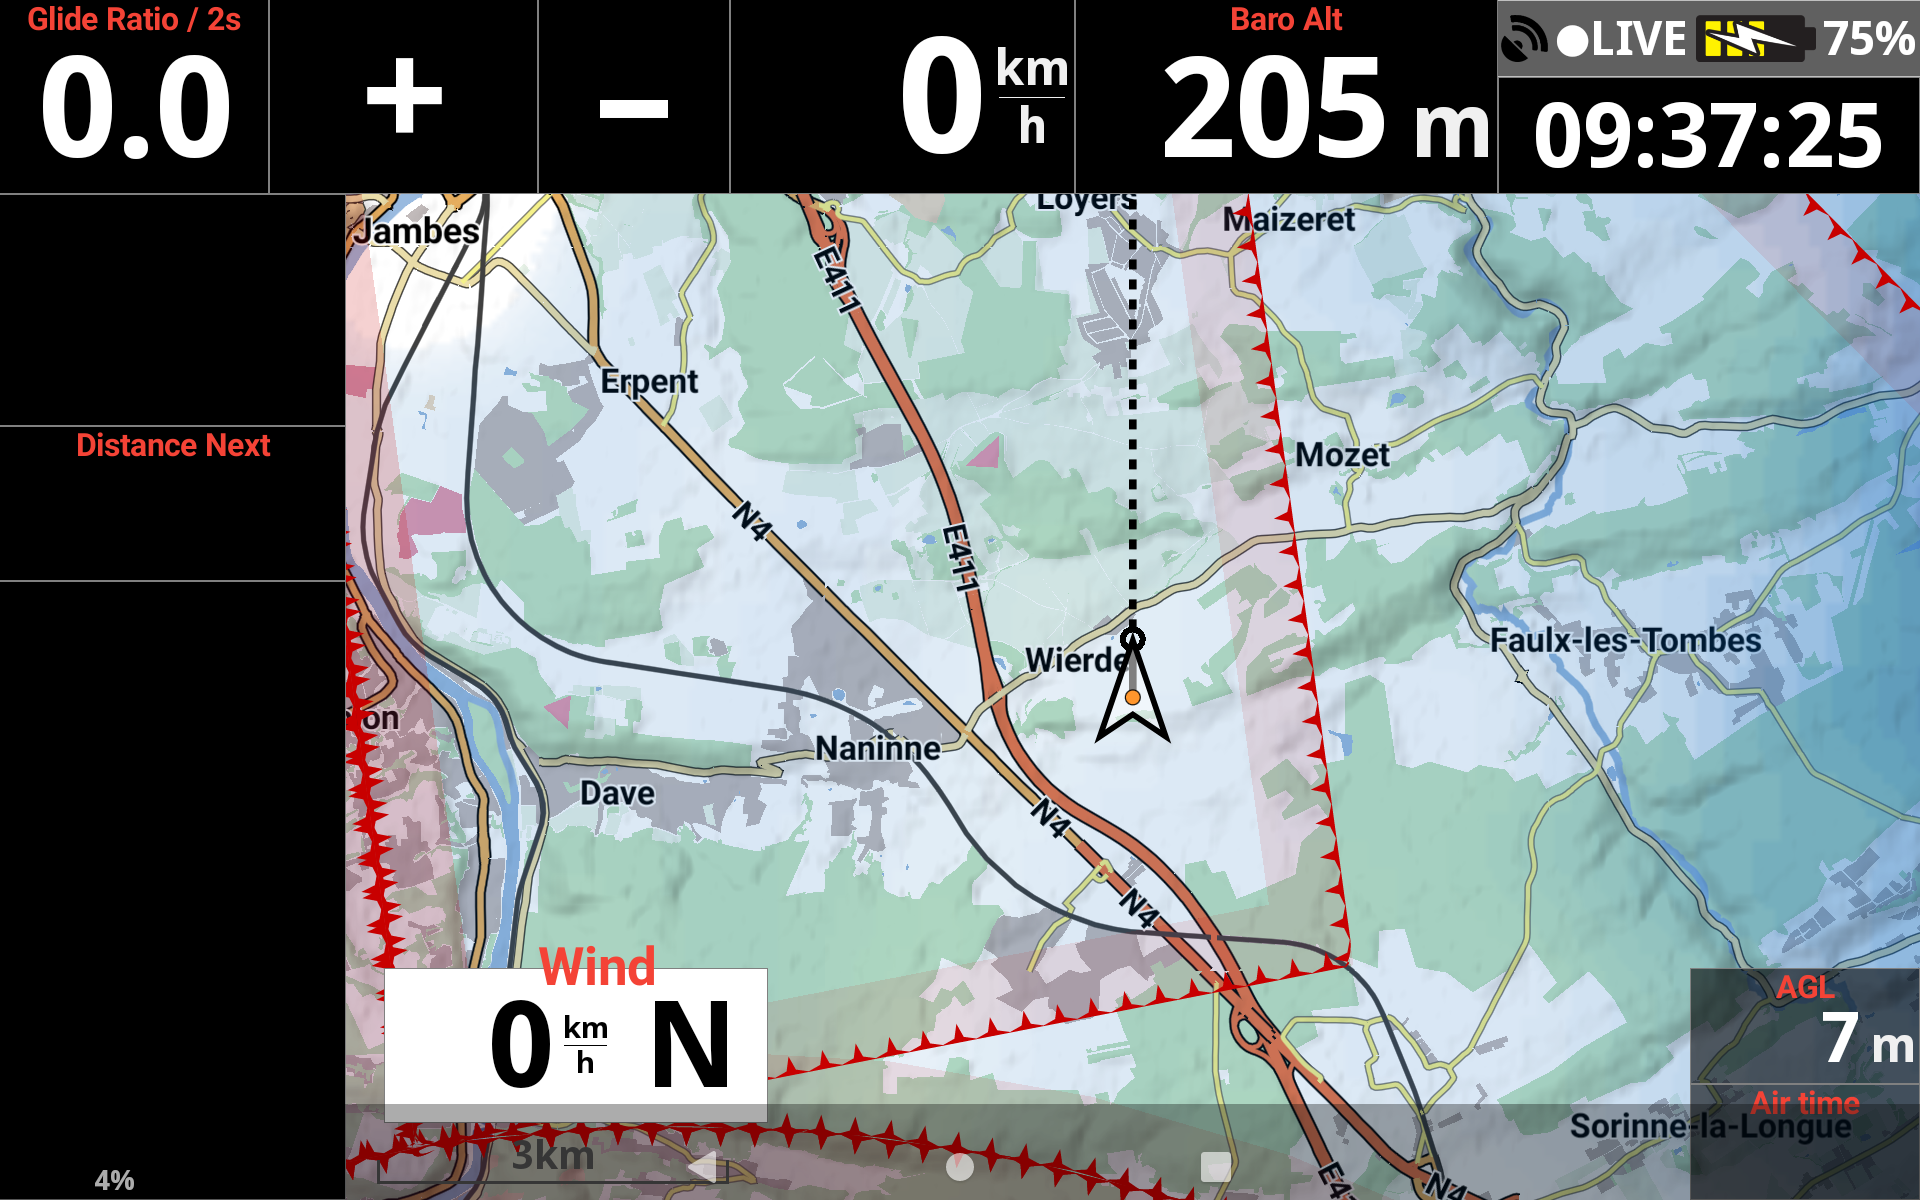
Show bearing line
By disabling “Show bearing (course) line“, the Bearing line in front of the pilot will be removed.
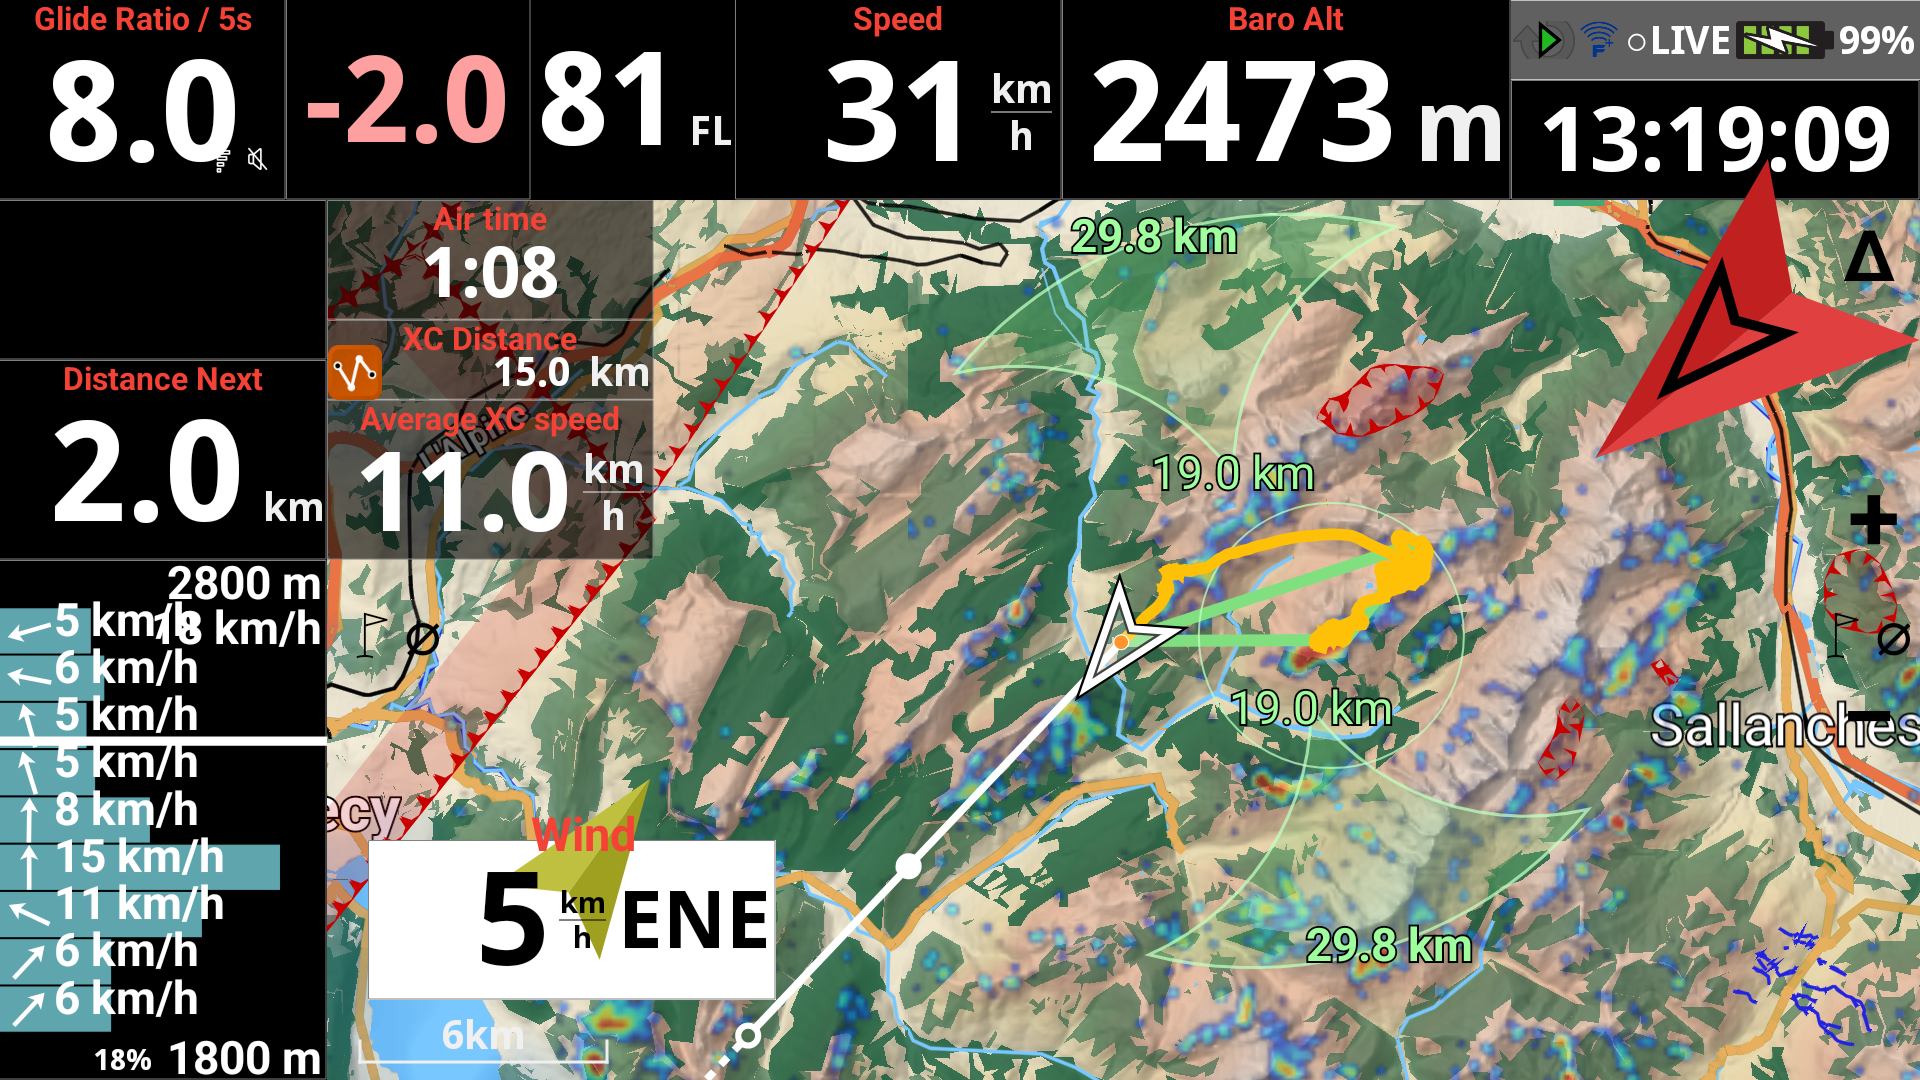
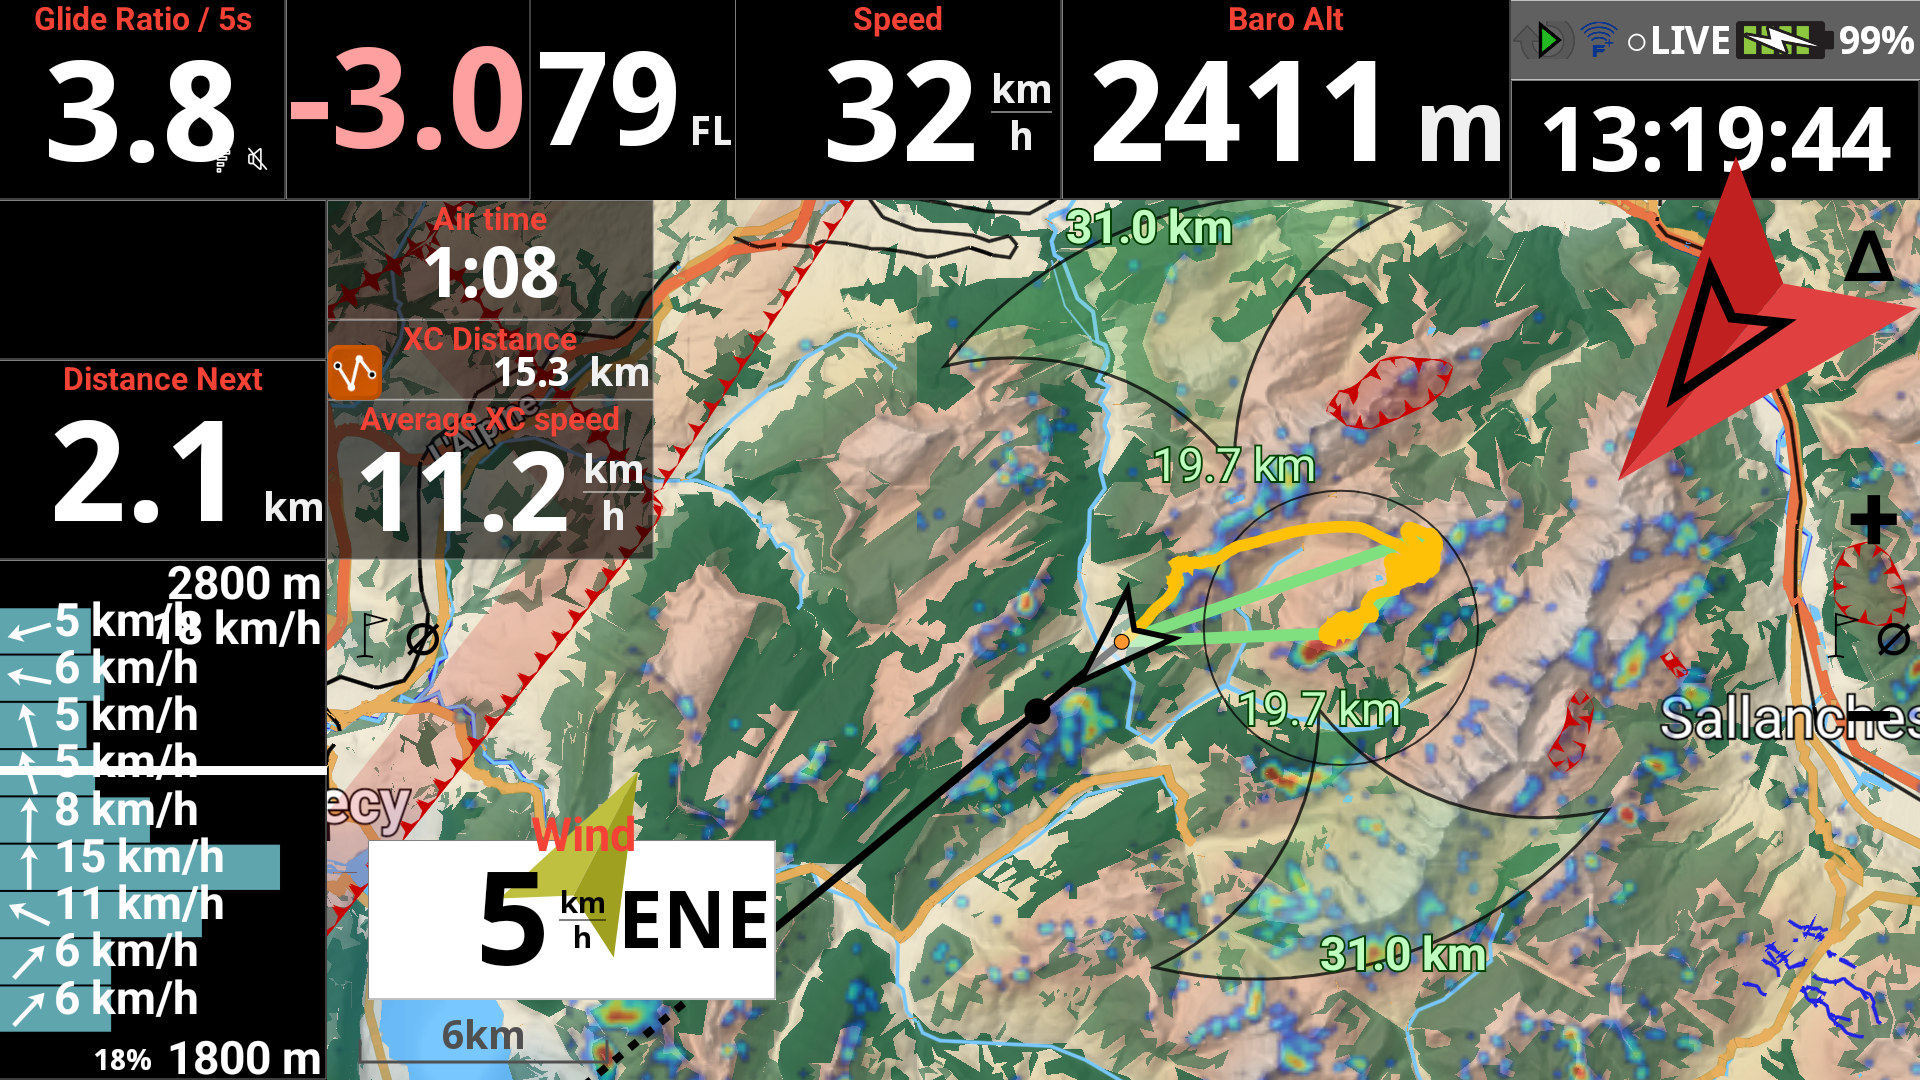
Mark glide distance
If you do not “Mark glide distance“, the Bearing line in front of the pilot will be straight without any other info.
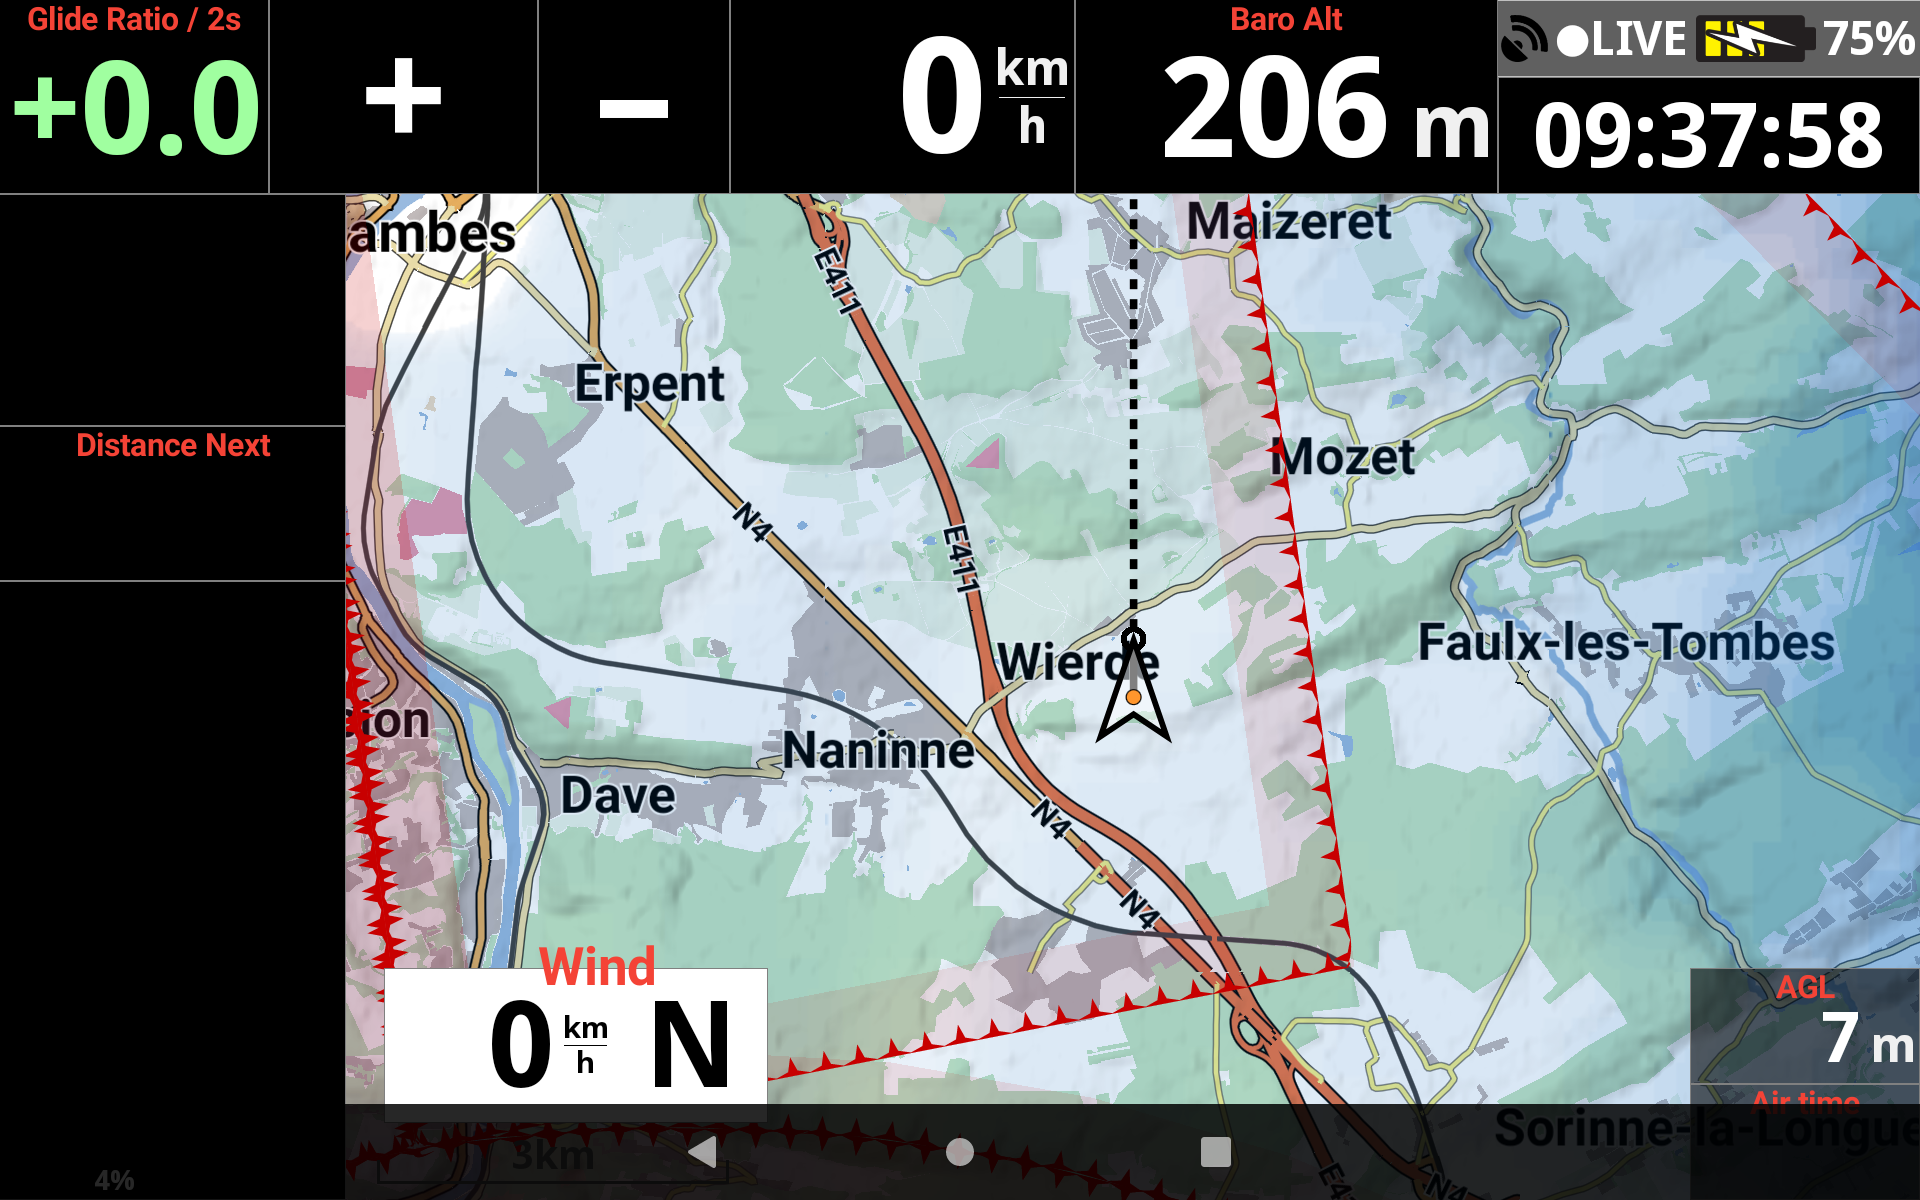
By enabling it, an empty circle will mark glide distance based on the configured glide ratio, trim speed and computed wind.. Solid circle marks glide distance based on the current glide ratio. Read more details about Glider setup in Menu/Preferences/Aircraft.

Mark glide distance disabled

Mark glide distance enabled

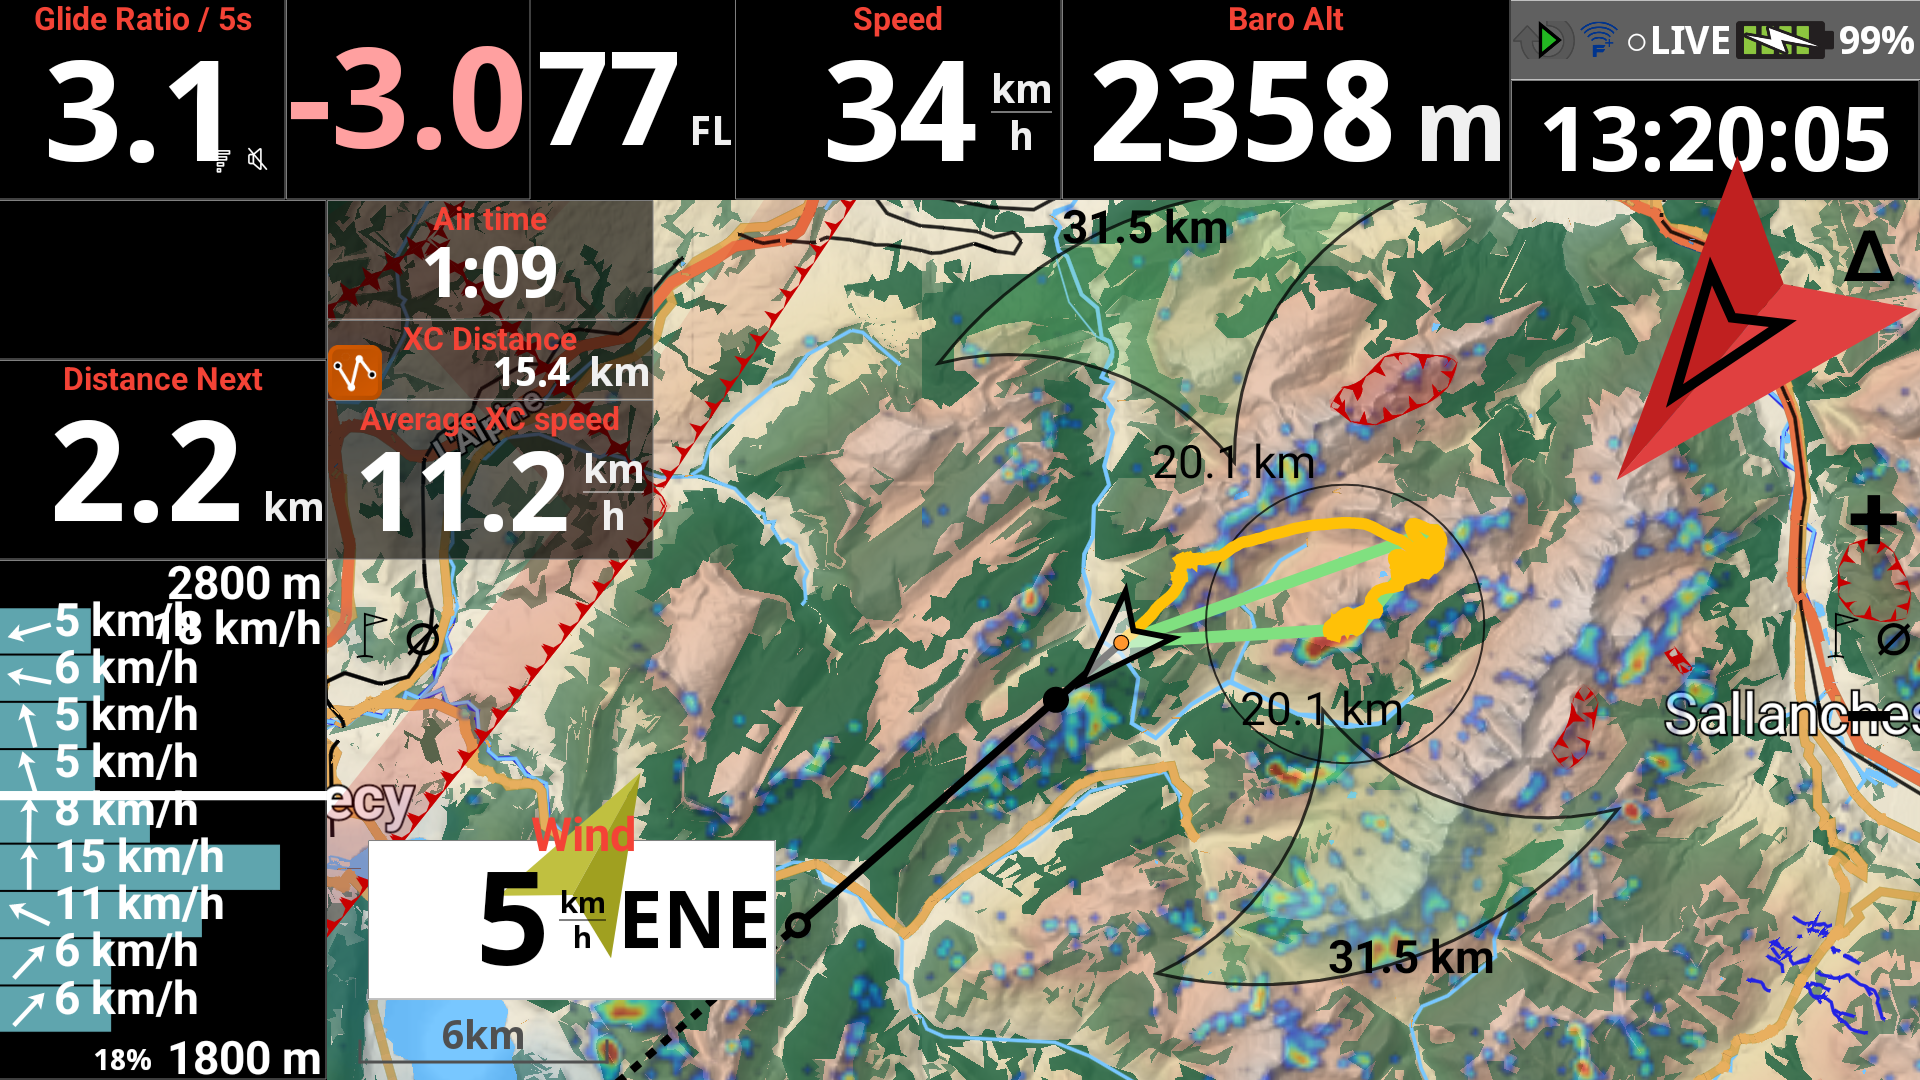
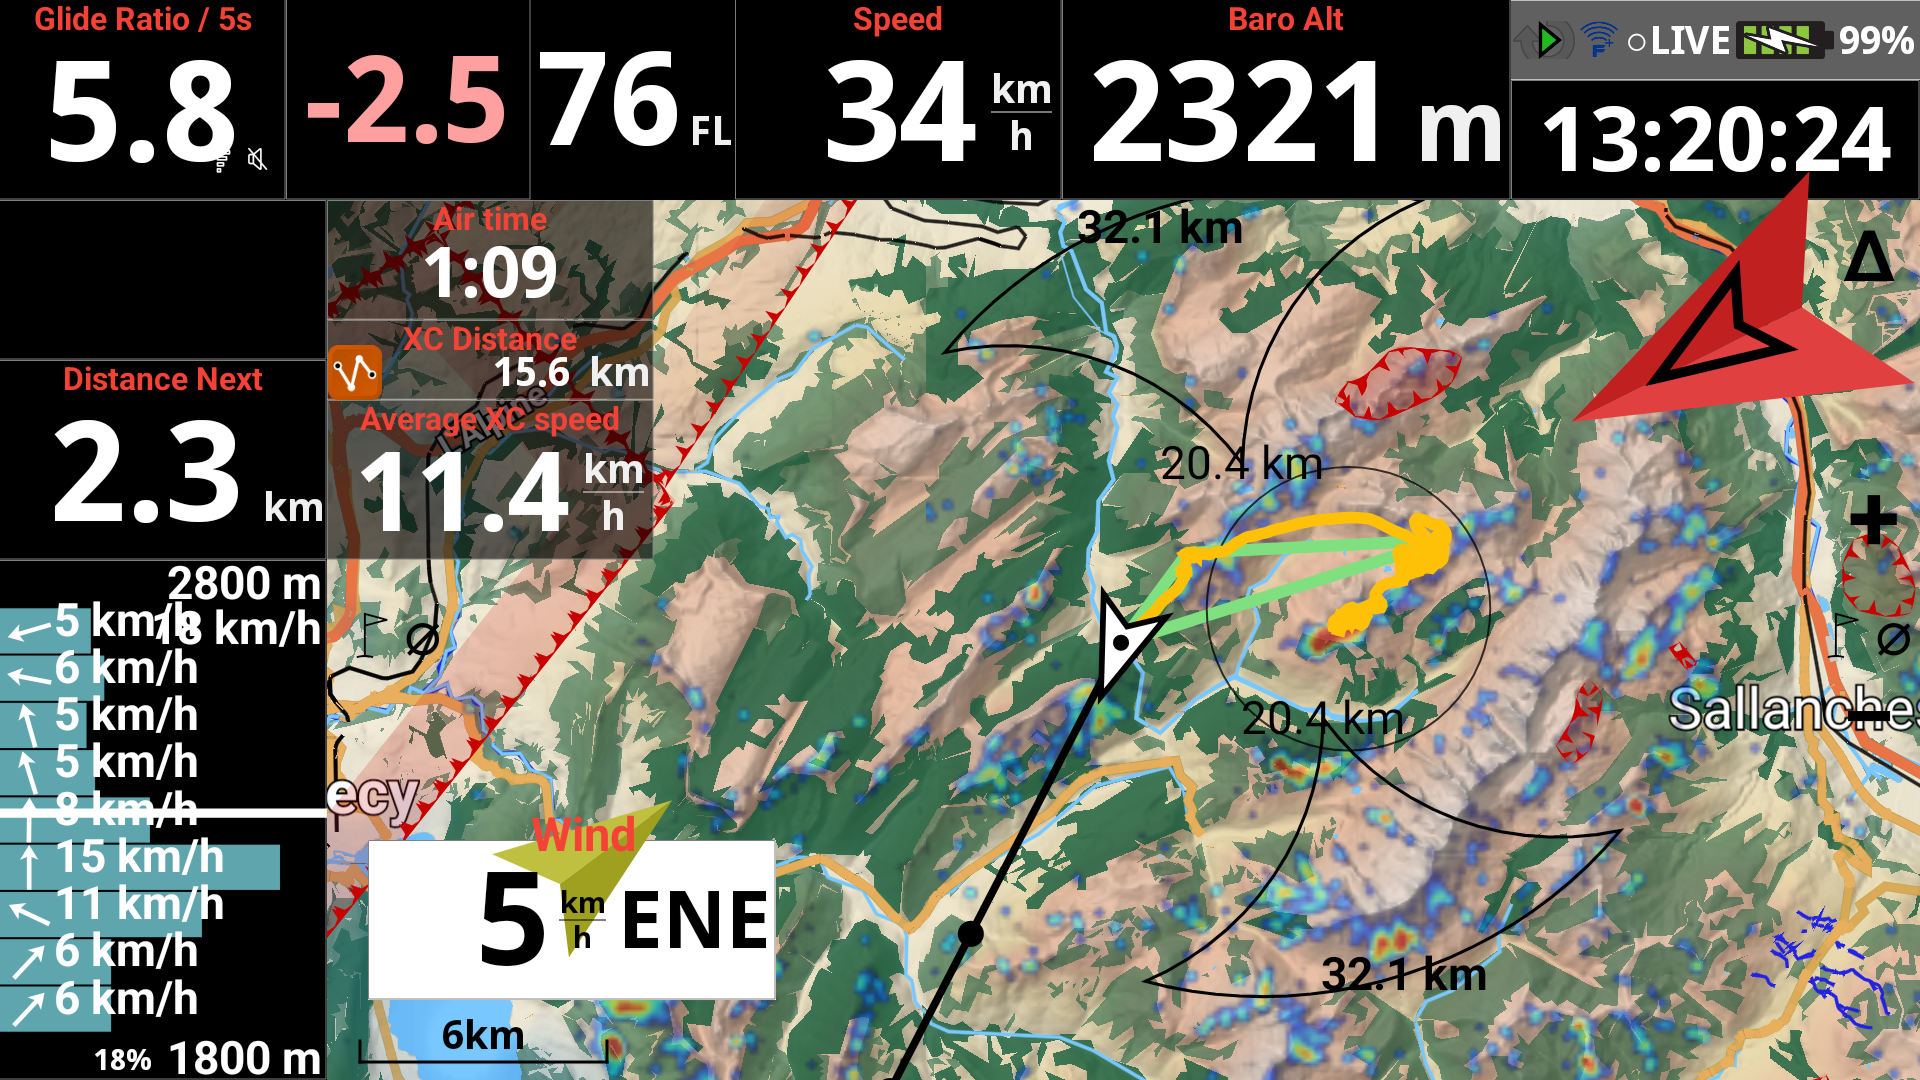
Thickness of lines
The thickness of lines will determine the thickness of the track on the map as well as the thickness of the line showing the Bearing direction in front of the pilot.
If you have the Pro version, you can change the color of the tracklog.
You can modify the Pilot arrow size to better identify the current heading by increasing the coefficient.
Depending on the wind direction and strength, you can therefore better visualize at any moment the Heading (Pilot arrow) and the Bearing (Line in front of the pilot).
By default, XCTrack uses the Bearing/track direction thanks to the GPS, the wind speed and direction to compute the Heading direction.
By enabling “Use internal compass” in Menu/Preferences/Connection & sensors, XCTrack uses the information coming from the internal compass to display the Heading.
Read more details on using the internal compass in the Preferences page of XCTrack Pro manual.

Font Size
You can choose between small, medium or large. This parameter has a direct influence on all textual information other than that directly included with the Roadmaps, such as waypoint name, Airspace info, …
If you want to change the display size of the cities that are included with the Roadmaps, read this FAQ.
By setting in the map configuration to display airspaces, the airspace whose floor is above the set limit can be deferred. Approaching a set distance, the deferred airspace can be displayed.
By using the expert mode of AIR³, a dedicated page is available for airspaces management.
If you are interested to know more about Airspaces with AIR³, watch the dedicated tuto video in the videos’ page and read more details about Airspaces in Menu/Preferences/Airspaces

Next section: